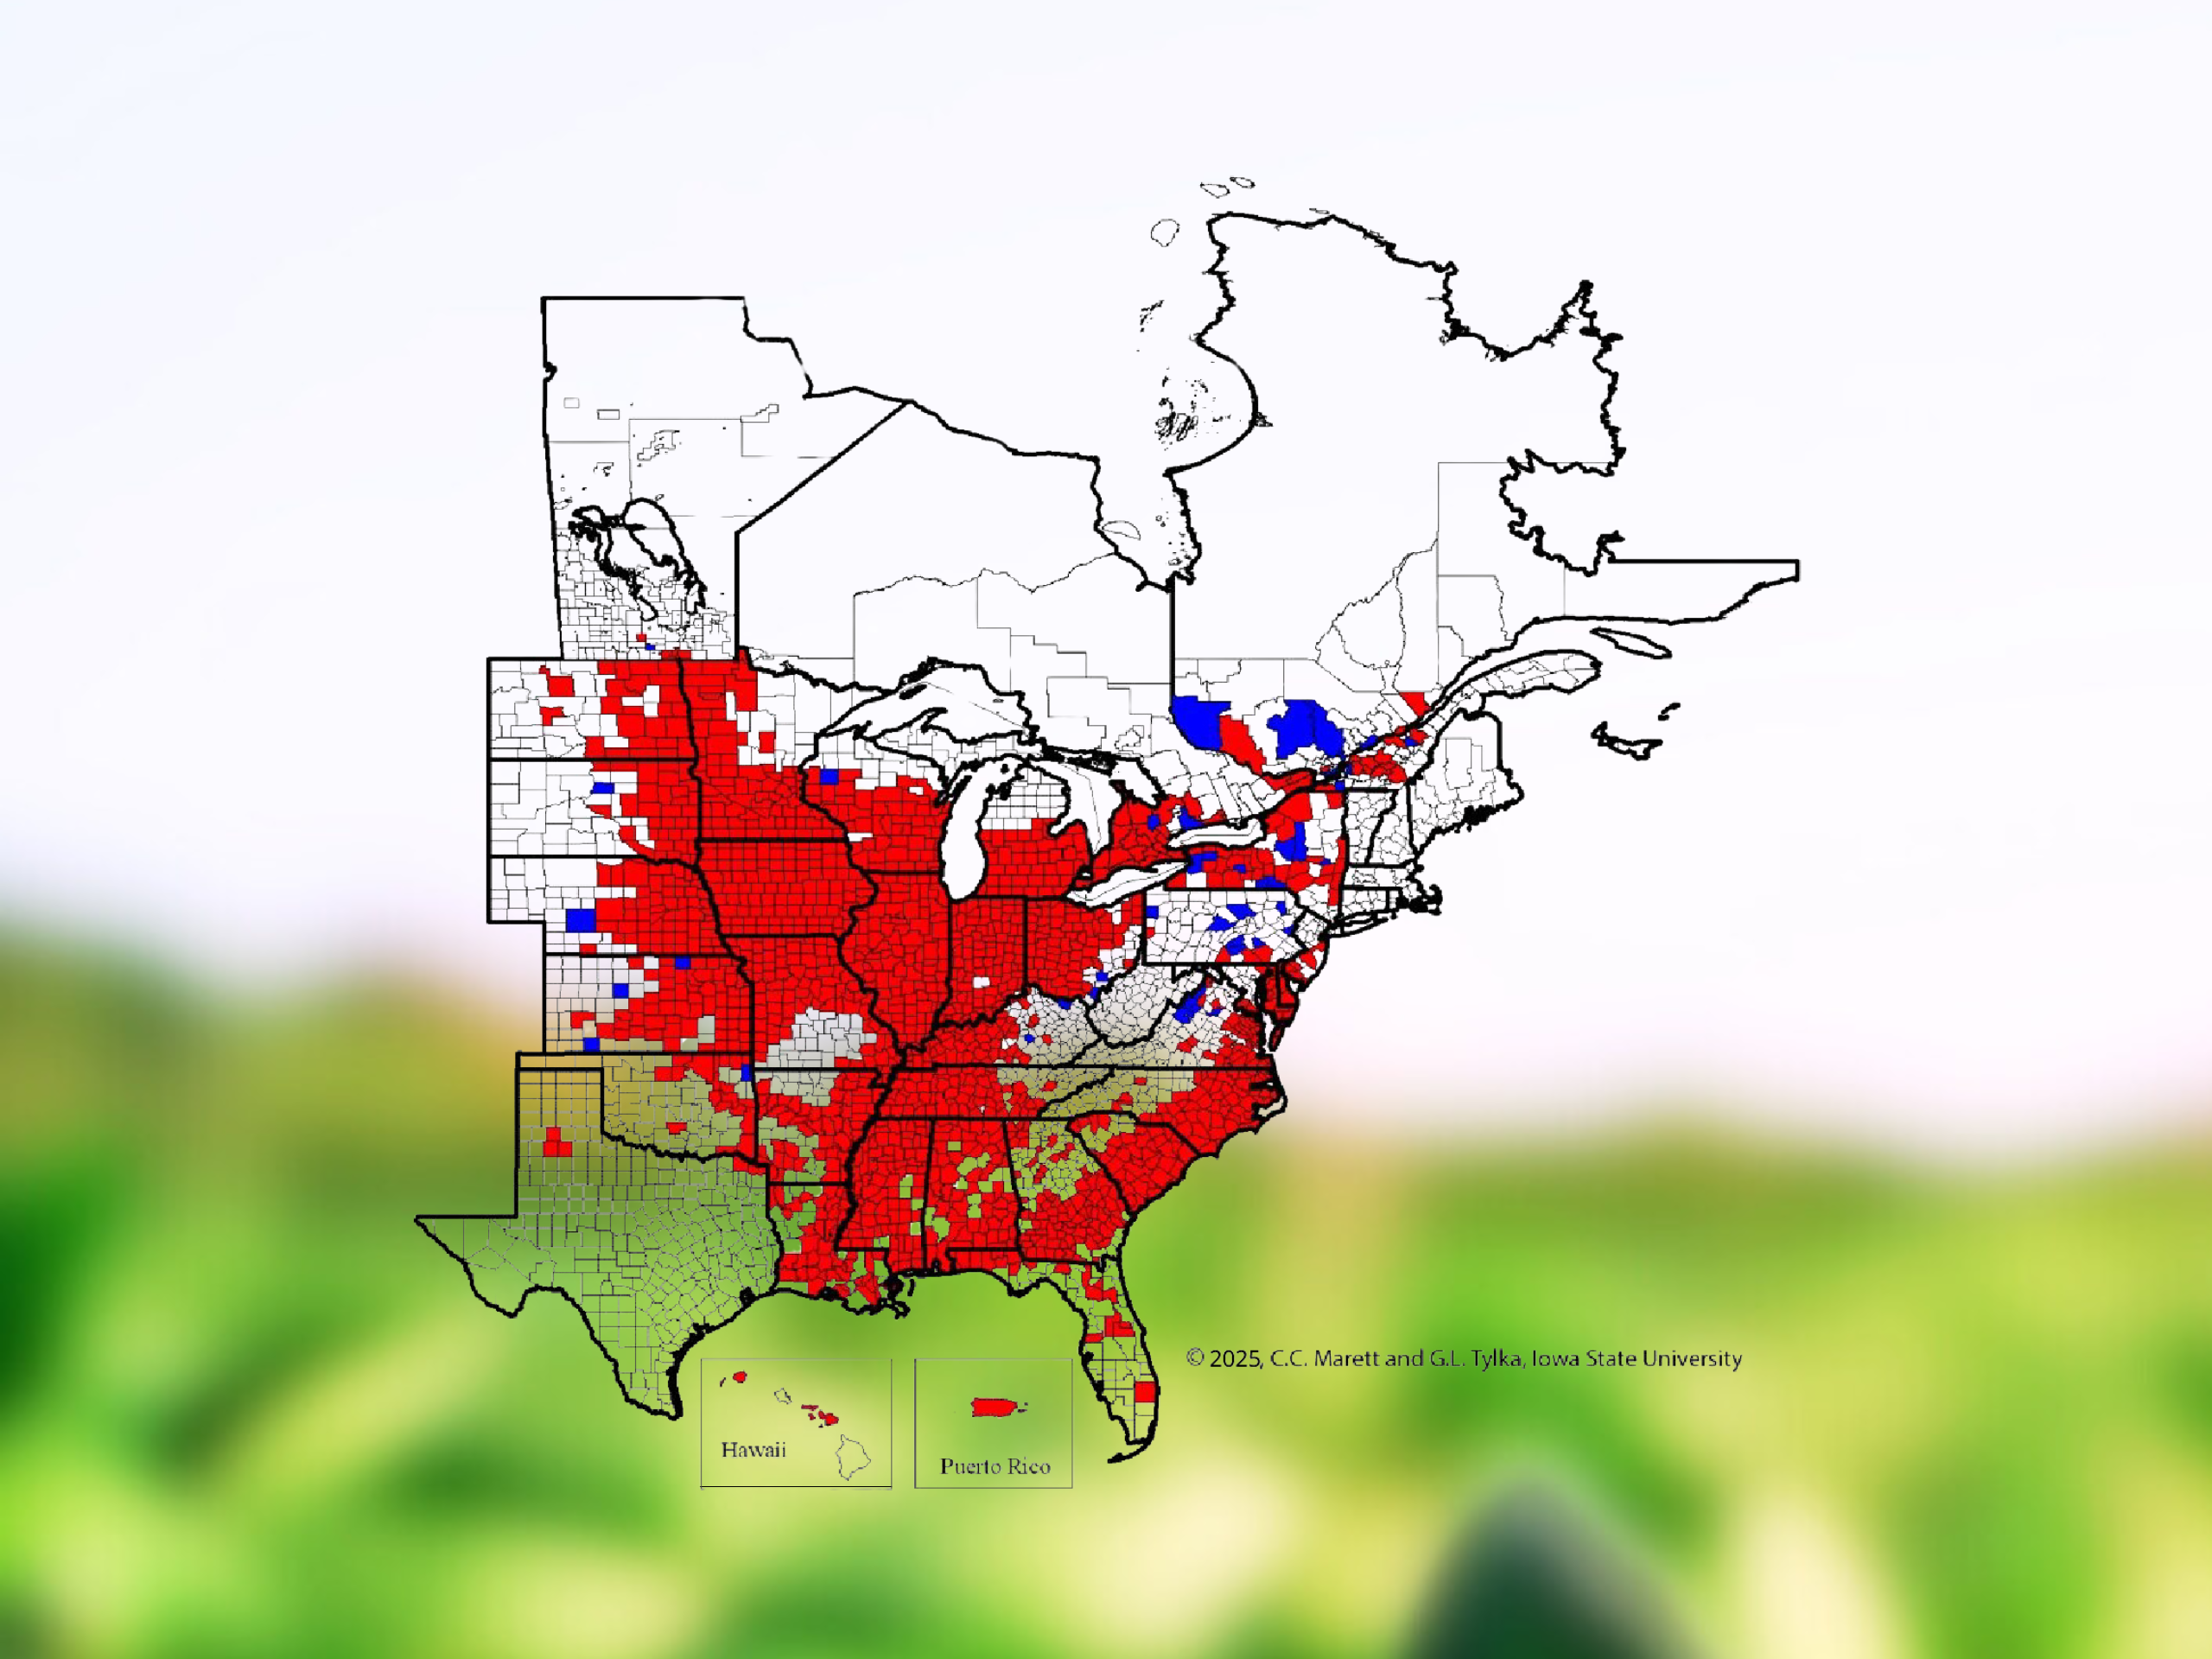
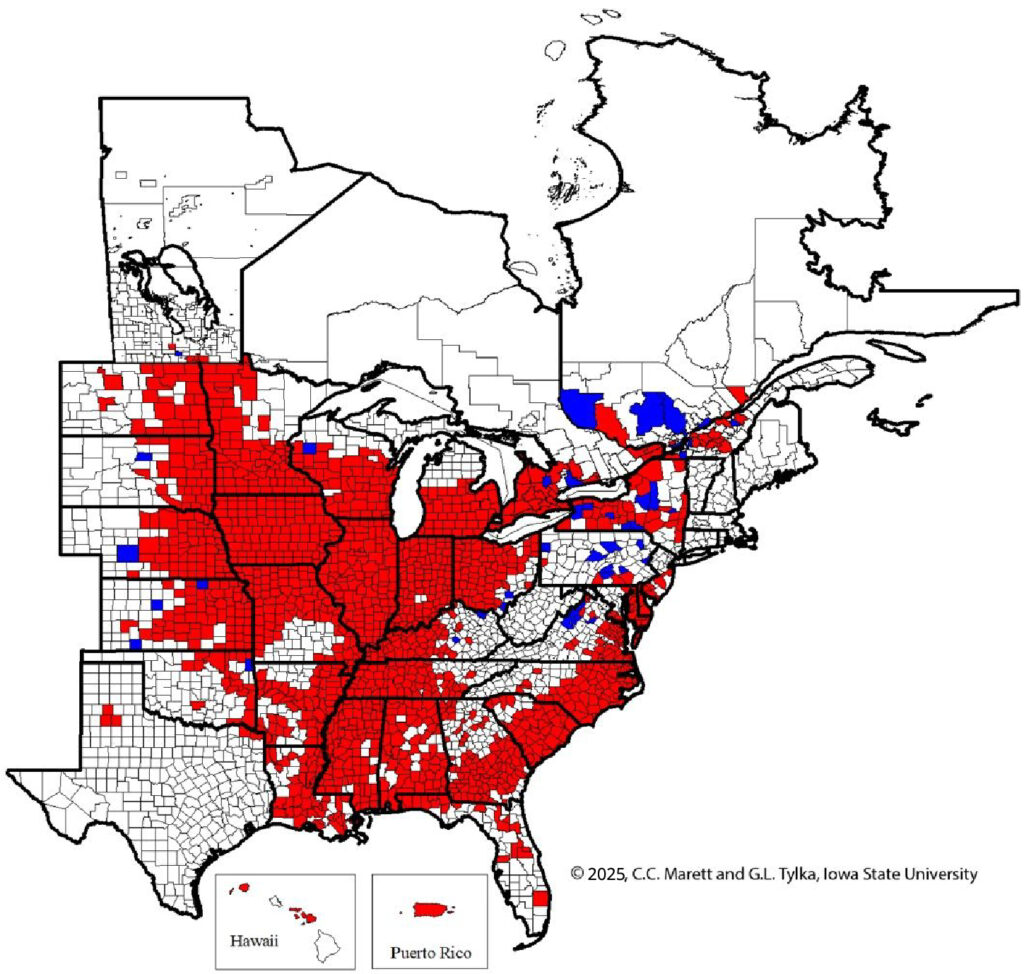
Researchers have been updating the map of known soybean cyst nematode (SCN) distribution regularly since 2000, and with each update, the threat spreads. The latest update, spearheaded by Iowa State University (ISU) nematologist Greg Tylka, reveals 31 counties in 10 U.S. states reporting SCN for the first time during the 2020 through 2023 timeframe.1
In Canada, 10 rural municipalities in Quebec and three counties across Manitoba and Ontario reported SCN for the first time over that three-year span.
SCN widespread in soybean-producing areas
Most of the primary soybean-producing areas in the U.S. and Canada overlap the SCN distribution map. In the U.S., SCN affects average soybean yield in every county of Illinois and Iowa, the top two soybean-producing states.
SCN costs U.S. soybean farmers more yield than any other pathogen. Losses due to SCN are double that of the next largest pathogenic threat.2 Based on SCN’s ongoing spread, Tylka says, “It’s reasonable to conclude that increased soybean yield losses due to the nematode will follow, if not already occurring in these areas.”
And just because an area is not reporting SCN does not mean fields there are free of the pathogen. “Fields may be infested with the nematode for many years before infestations are discovered,” the report notes.
Why SCN is tough to beat
After the initial discovery of SCN in North America in 1954, breeders developed varieties with genetic resistance to SCN, namely PI 88788 soybeans and Peking soybeans. “A great majority of SCN-resistant soybean varieties available throughout soybean-producing areas of the U.S. and Canada were developed with resistance genetics from PI 88788,” Tylka explains. But after decades of overuse, SCN populations developed resistance to PI 88788.
While PI 88788 resistance still dominates seed company offerings, the number of soybean varieties with Peking resistance is rising. In fact, the number of varieties with Peking resistance available to Iowa farmers in 2025 more than doubled from last year to 200, according to ISU’s annual checkoff-funded publication. The list contains a total of 920 SCN-resistant soybean varieties.
“Farmers now have many choices of varieties with Peking SCN resistance from many brands,” Tylka says. “That enhances their ability to rotate resistant varieties, a key element of active SCN management.”
Actively managing SCN
To combat mounting resistance to PI 88788, The SCN Coalition encourages farmers to work with their trusted agronomic adviser to develop a management plan, including:
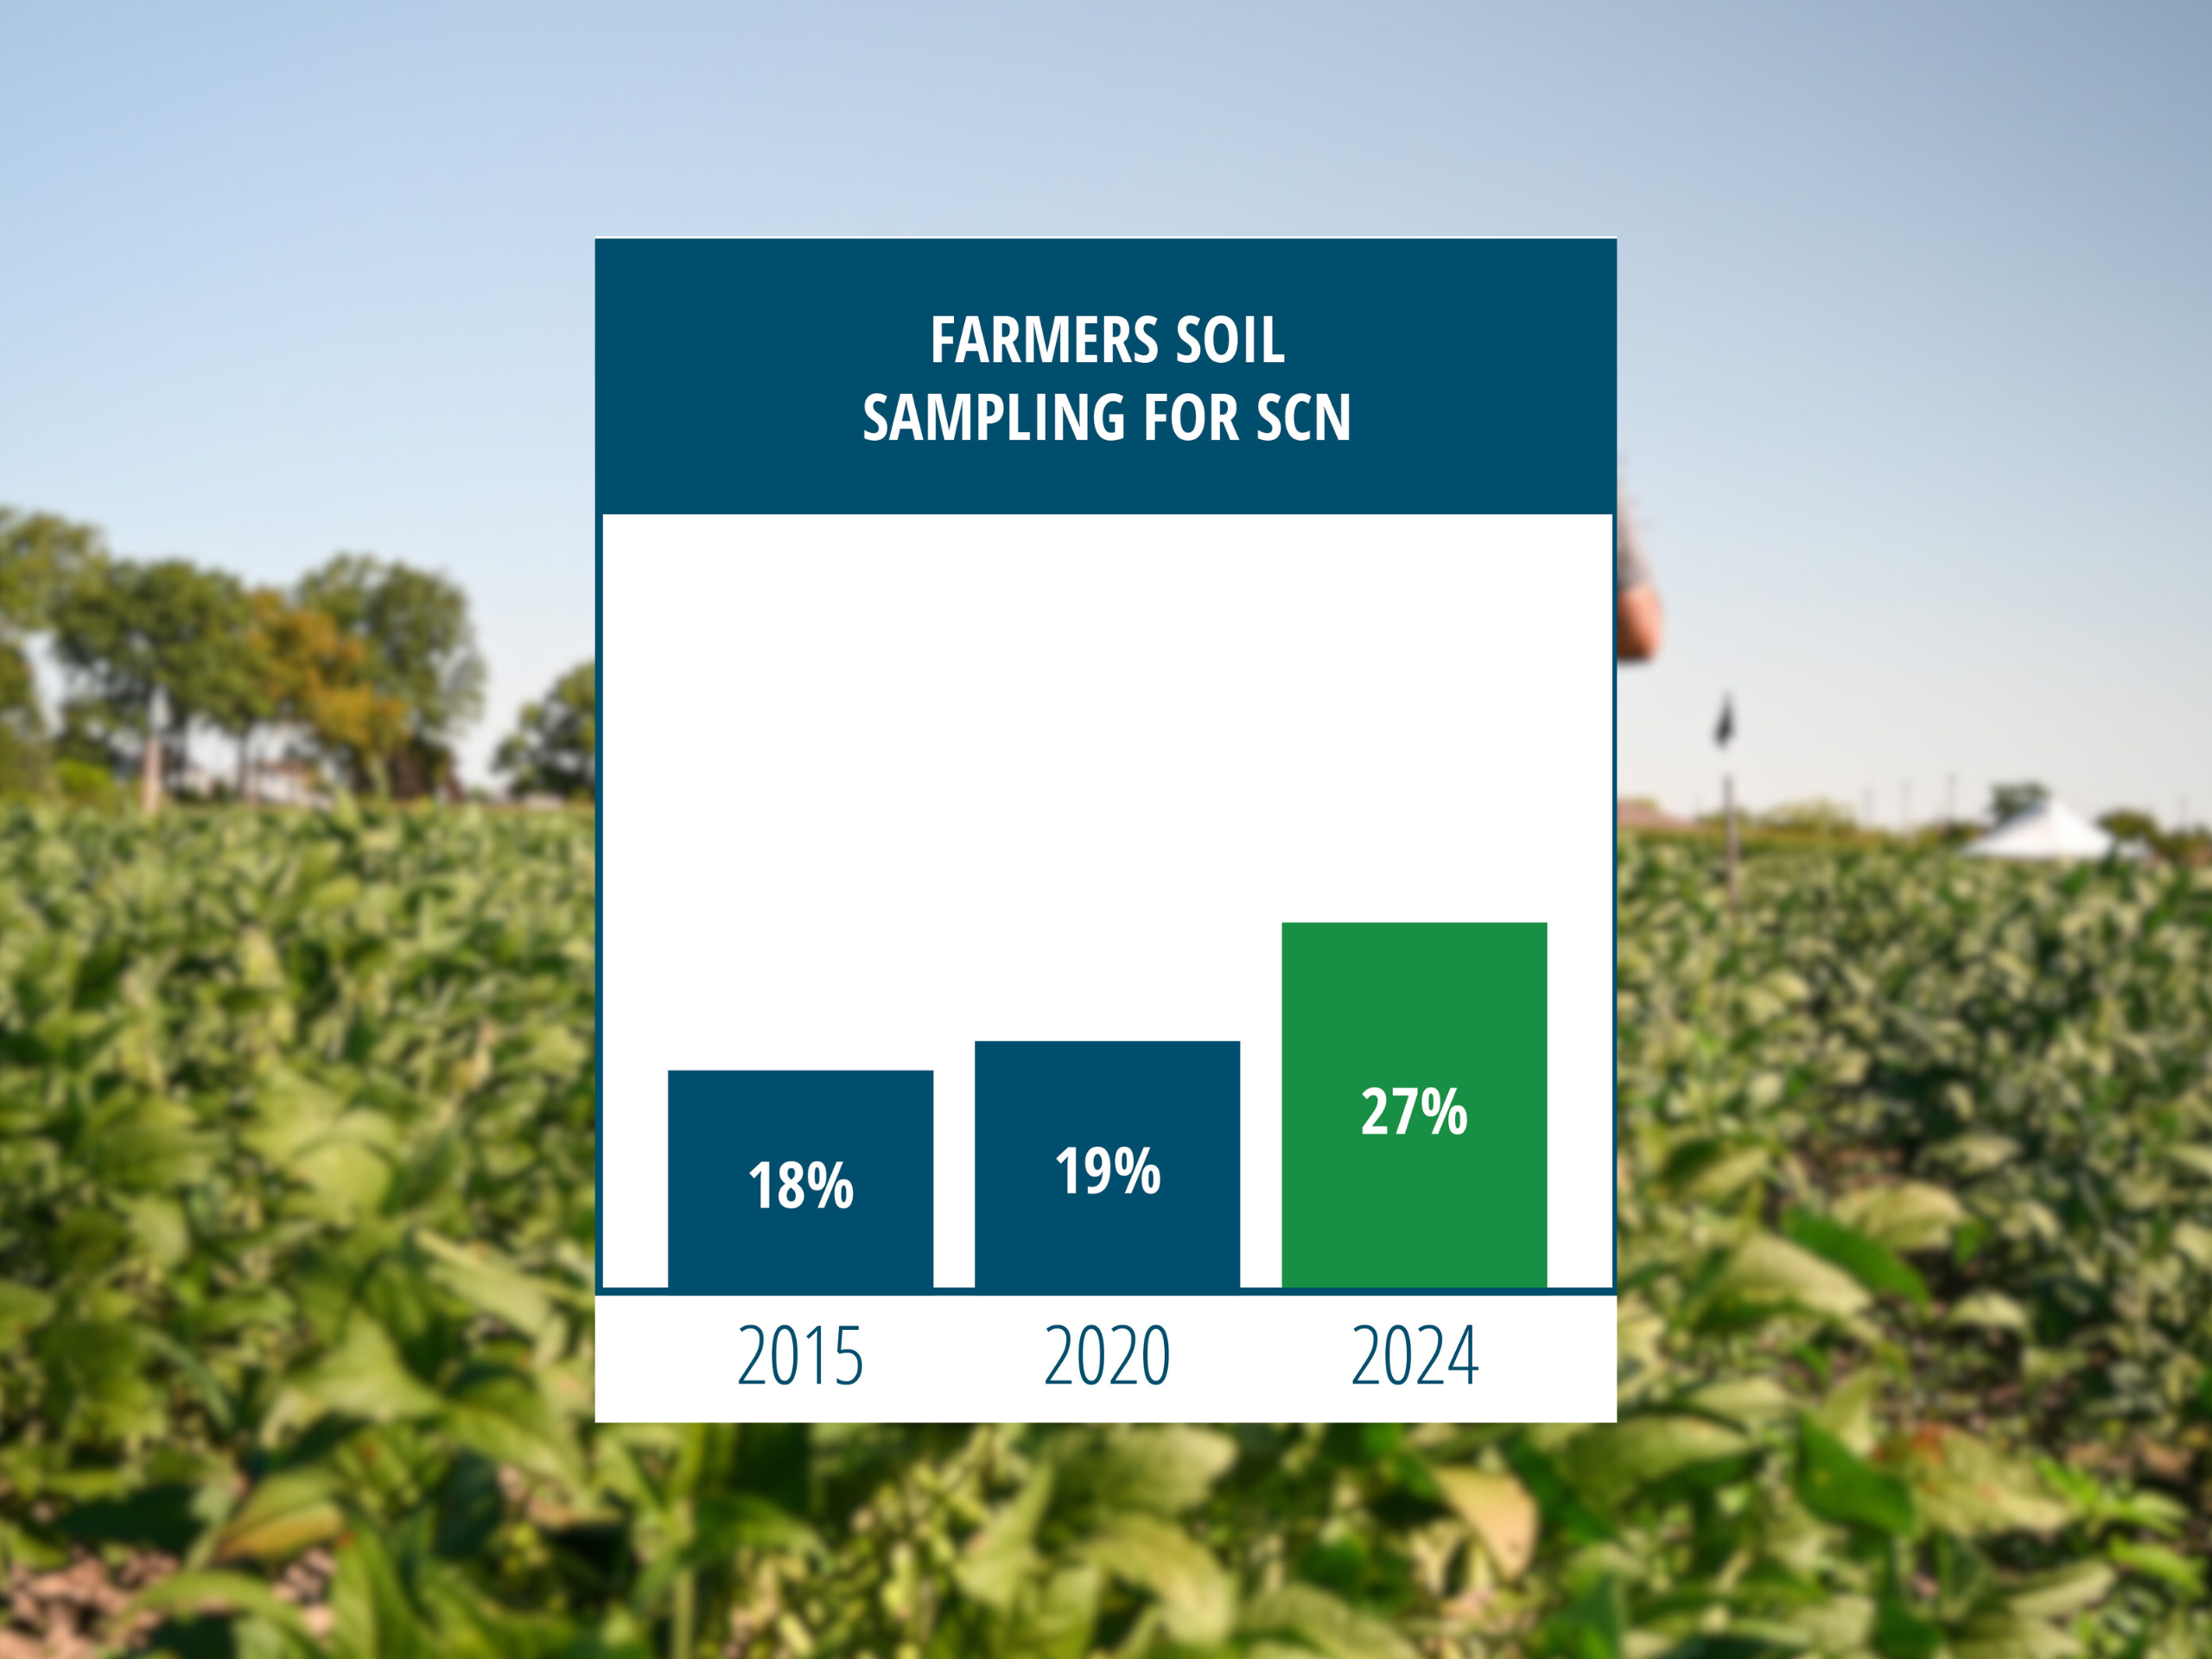
- Test soil to know your numbers.
- Rotate resistant varieties.
- Rotate to non-host crops.
- Consider using a nematode-protectant seed treatment.
Because soybeans with Peking SCN resistance will likely outyield PI 88788 resistance varieties in SCN-infested fields, it can be tempting to plant Peking over and over. But that’s a bad idea. Prolonged use of Peking SCN resistance will create its own resistance battle. The best strategy is to rotate resistance types.
Defining SCN’s toll on a field-by-field basis
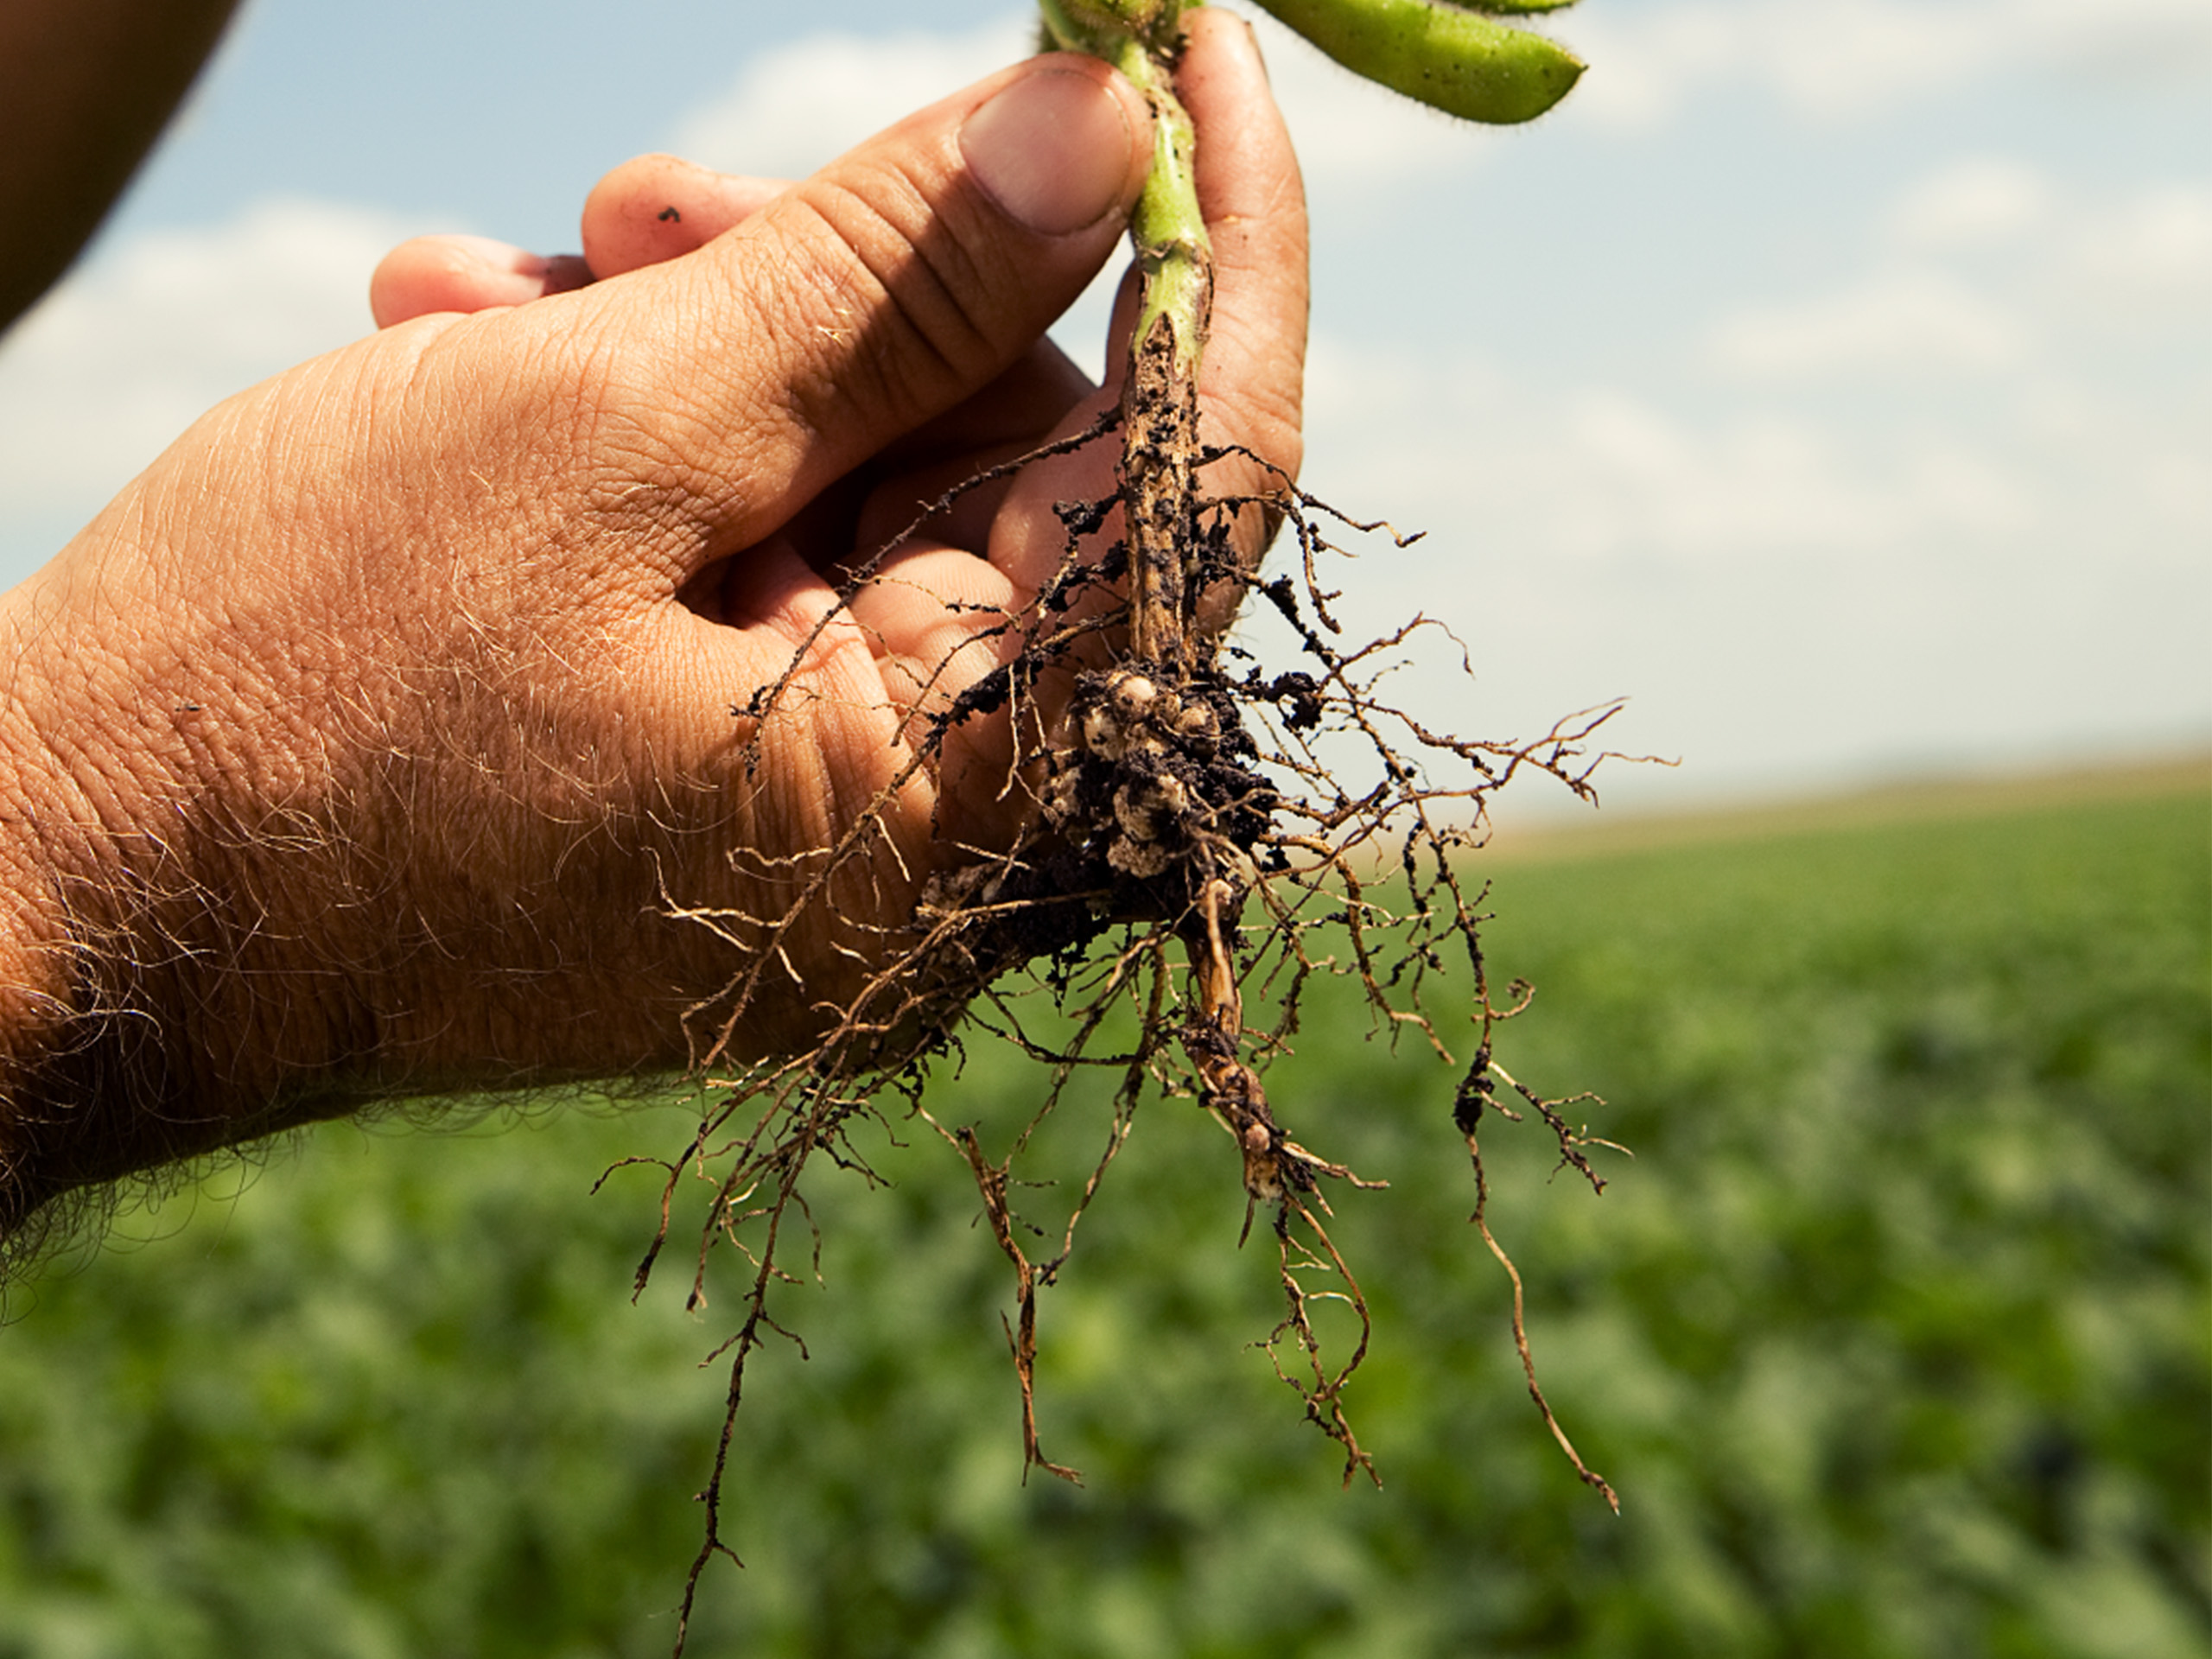
Soybean cyst nematode damage can be hard to see in field. SCN robs soybean yield with little to no aboveground symptoms. For that reason, spreading awareness about the threat and its economic damage are priorities for The SCN Coalition. SCN’s wide distribution focuses attention on the pathogen and can motivate more farmers to test their fields.
Farmers can get an estimate of SCN yield loss and how it impacts their bottom line by using the SCN Profit Checker calculator. Powered by data from more than 25,000 university research plots, the tool estimates the economic toll of SCN, field by field. By giving farmers the ability to put dollars and cents on SCN’s toll, the Coalition hopes to increase active management of the pathogen.
To learn more about active SCN management in your state, visit thescncoalition.com/experts.

